COVID-19 by the numbers
Read this article for free:
or
Already have an account? Log in here »
To continue reading, please subscribe:

Digital Subscription
One year of digital access for only $205*
- Enjoy unlimited reading on winnipegfreepress.com
- Read the E-Edition, our digital replica newspaper
- Access News Break, our award-winning app
- Play interactive puzzles
*First annual payment billed as $205.00 + GST for one year. This annual subscription will automatically renew at $233.00 + GST every 52 weeks (10% off the regular annual price of $259.35). Offer available to new and qualified returning subscribers only. Cancel any time.
To continue reading, please subscribe:
Add Free Press access to your Brandon Sun subscription for only an additional
$1 for the first 4 weeks*
- Enjoy unlimited reading on winnipegfreepress.com
- Read the E-Edition, our digital replica newspaper
- Access News Break, our award-winning app
- Play interactive puzzles
*Your next Brandon Sun subscription payment will increase by $1.00 and you will be charged $17.95 plus GST for four weeks. After four weeks, your payment will increase to $24.95 plus GST every four weeks.
Read unlimited articles for free today:
or
Already have an account? Log in here »
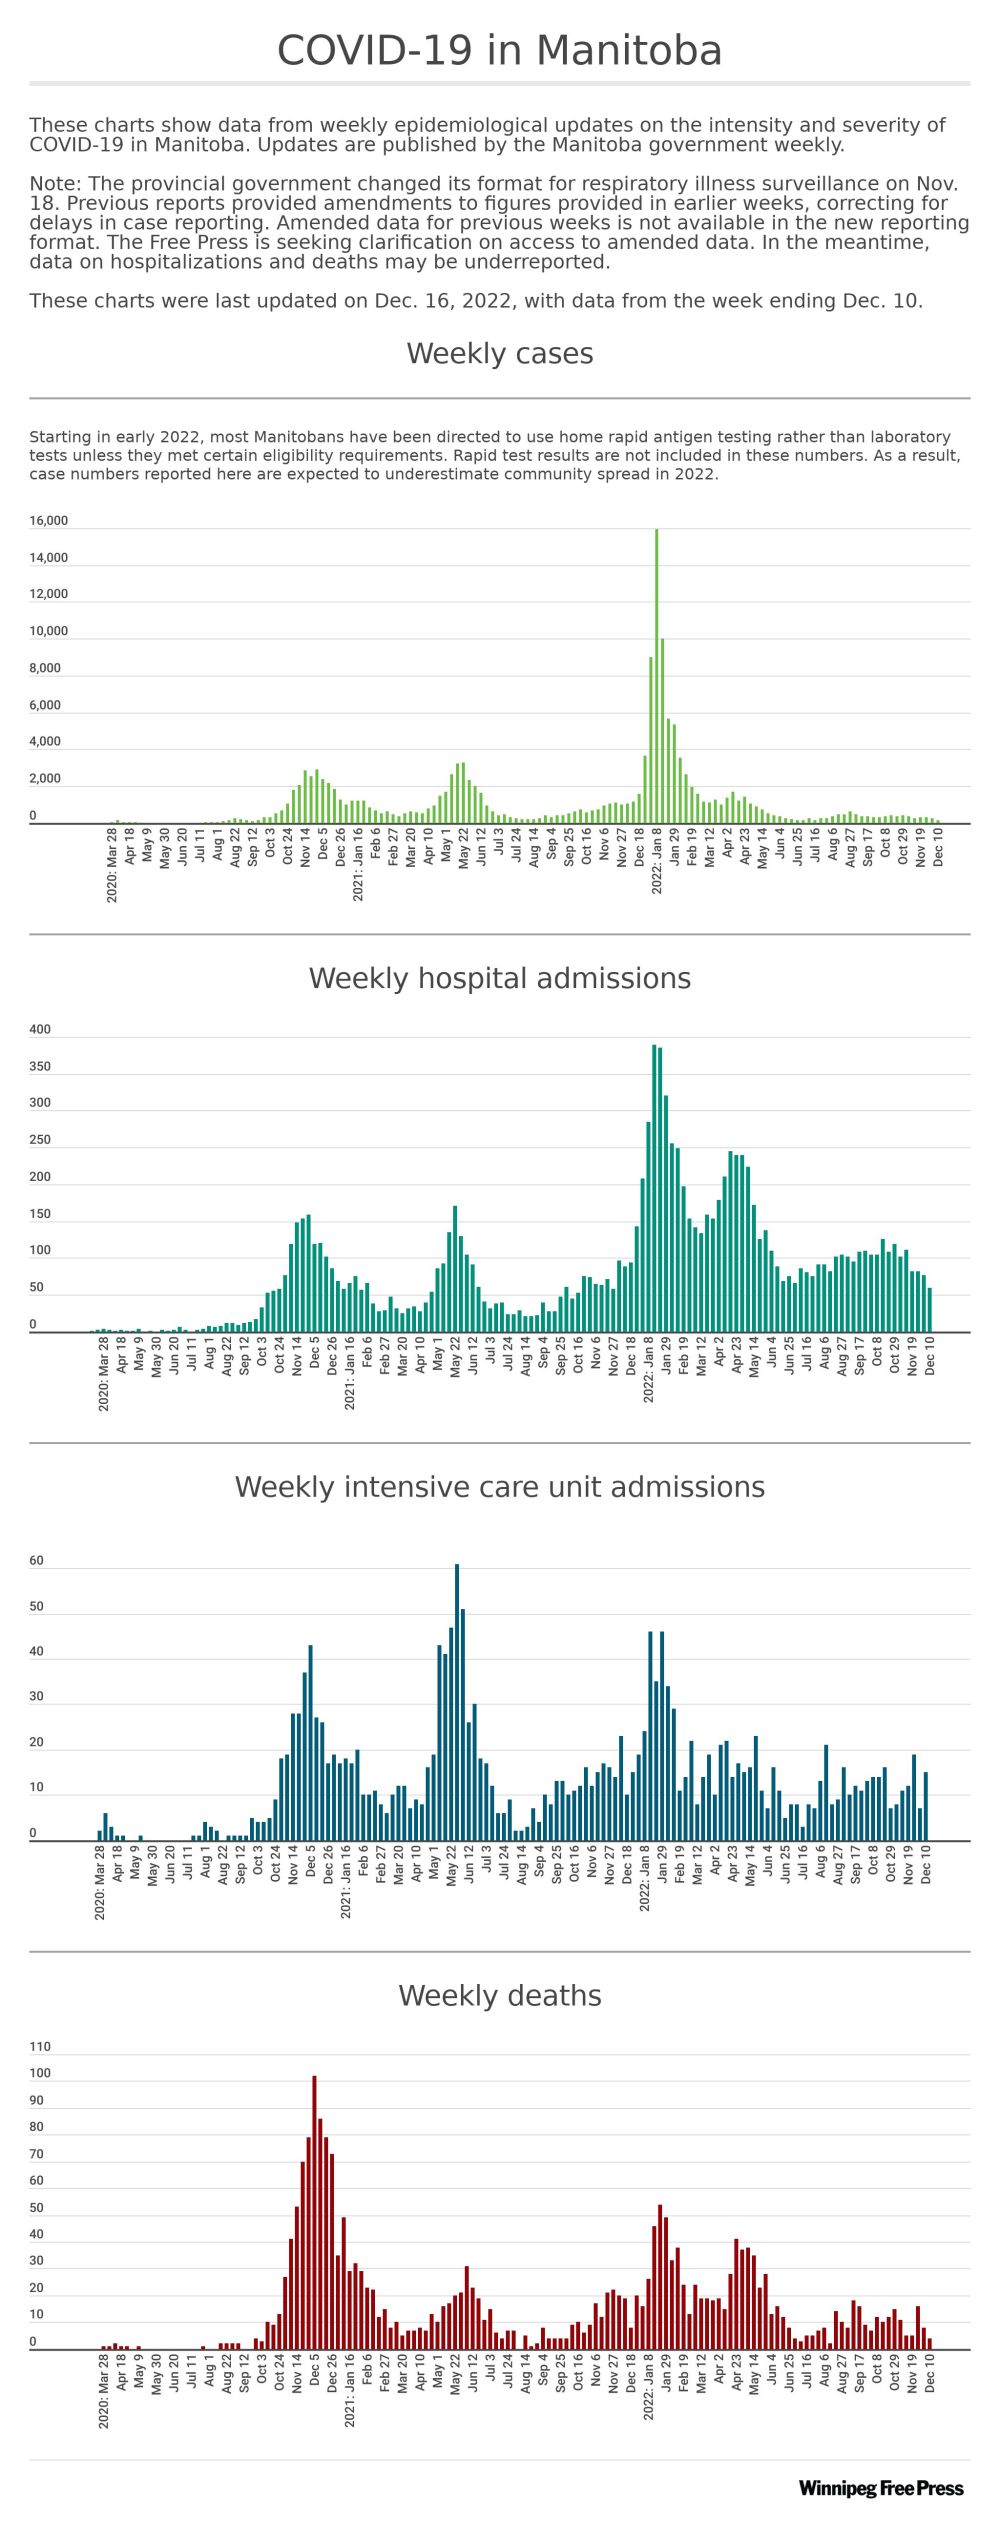
The Winnipeg Free Press is tracking the status of COVID-19 in Manitoba, as reported by provincial and federal health authorities.
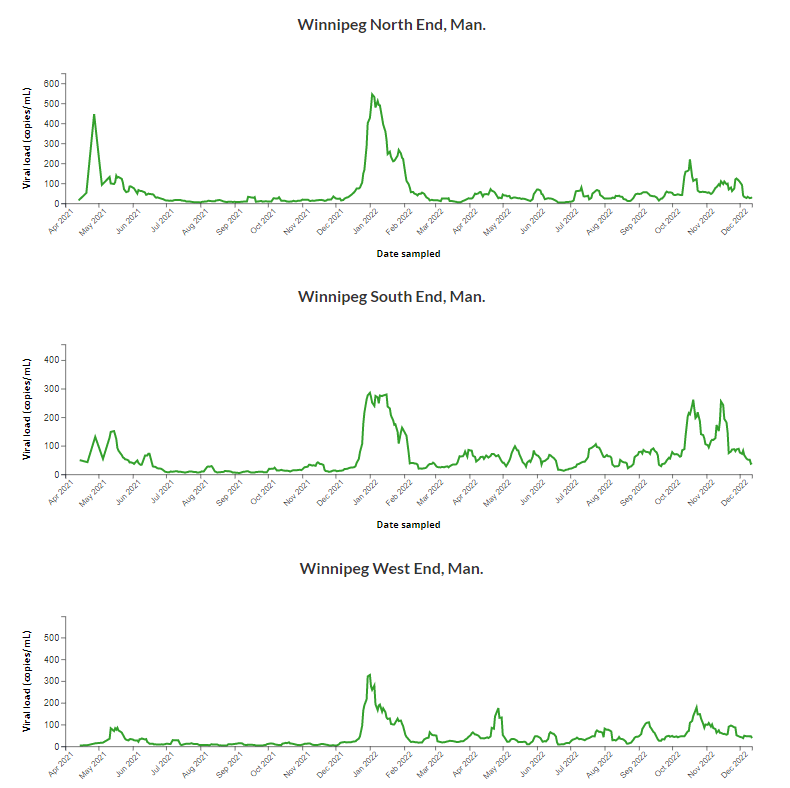
Wastewater surveillance
Health Canada’s wastewater dashboard shows the concentration of COVID-19 in wastewater samples from different sites.
The green line shows the seven-day rolling average of the viral load for each site. Health Canada calculates the seven-day rolling average by averaging the viral loads from each day with the previous six days.
An ongoing increase or decrease in the viral load is more reliable for indicating trends. If the wastewater signals are high or increasing, this may indicate a high level of COVID in the community.
The chart below shows wastewater surveillance in Winnipeg as reported from April 2021 — when data first became available in Winnipeg — to Dec. 12, 2022.
Vaccine uptake
The chart below shows the cumulative percentage of all people in Manitoba who have received a COVID-19 vaccine, by vaccination status. The chart is updated every four weeks.
Cumulative percent of people who have received a COVID-19 vaccine in Manitoba, by vaccination status, as of Dec. 4, 2022. (Health Canada)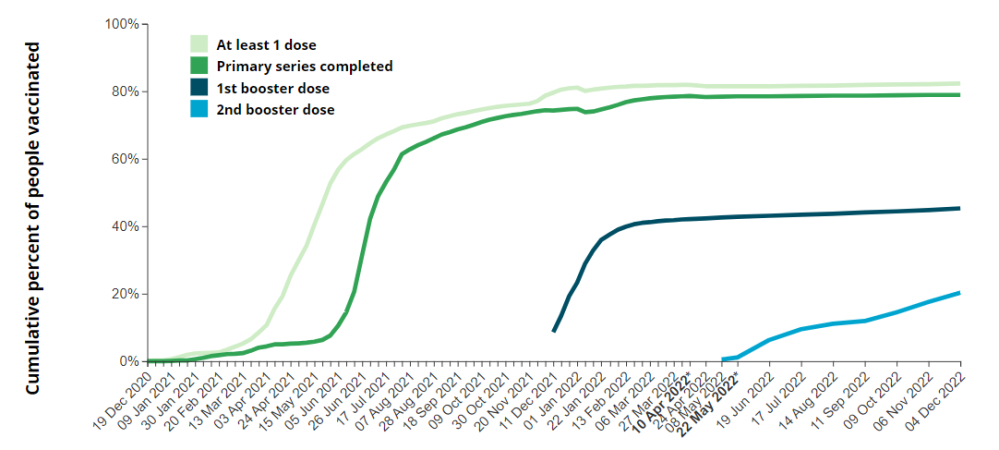
History
Updated on Wednesday, August 3, 2022 5:08 PM CDT: Removes charts that are no longer being updated.